Your municipality.
Your future.
Your vote.
Understand what political parties stand for, explore local election data, and verify the facts for yourself.
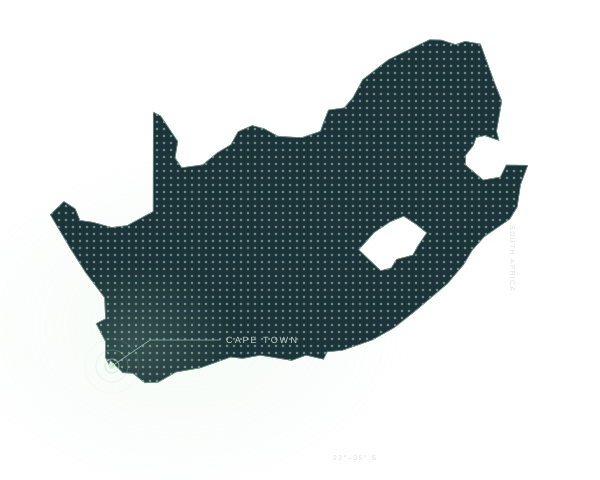
Local information. National ambition.
Your next local government election
Start with where you live.
Your municipality makes decisions that affect your daily life.
Get to know the choices in your community.
Cape Town
Western Cape CPT
Drakenstein
Western Cape WC023
George
Western Cape WC044
Saldanha Bay
Western Cape WC014
Stellenbosch
Western Cape WC024
No municipality found
Try another name or municipal code. Our first release covers selected Western Cape municipalities.
Find your area with the IEC ↗Starting local, growing carefully. Coverage and available evidence vary by municipality.
Make up your own mind.
The promises. Side by side.
Compare what parties have publicly committed to on the issues that shape your everyday life.
Compare political parties 02The story in the numbers.
Explore historical election results. Clear charts, the right context, and no predictions.
Explore election results 03Don’t take our word for it.
Go straight to the original documents. Every published position comes with its evidence.
Explore our sources
See where we’ve been.
Decide what’s next.
Local democracy has a history. Explore the results behind the headlines, one municipality at a time.
Explore historical resultsHistorical results are context, not a prediction of the next election.
City of Cape Town
2021 local government election PR ballot
Party vote share · % of valid PR votes · Five largest shares
View data table & calculation
Share of 913,444 valid proportional representation votes in City of Cape Town, all wards and all voting districts. Excludes 10,665 spoilt PR ballots. Other parties combines the remaining 42 parties; its share is calculated from their exact vote total. 913 444 valid votes. Chart shows the five largest shares; table includes all groups. Percentages rounded to two decimal places. Election year 2021. Last checked 2026-10-29.
| Party | Votes | Share |
|---|---|---|
| Democratic Alliance | 536 571 | 58.74% |
| African National Congress | 170 911 | 18.71% |
| Economic Freedom Fighters | 37 913 | 4.15% |
| GOOD | 33 656 | 3.68% |
| Cape Coloured Congress | 25 854 | 2.83% |
| African Christian Democratic Party | 20 886 | 2.29% |
| Vryheidsfront Plus | 14 025 | 1.54% |
| Patriotic Alliance | 13 102 | 1.43% |
| Other parties | 60 526 | 6.63% |
Elections come and go.
Accountability shouldn’t.
We’re starting with elections. Next: documented promises, municipal spending, and the evidence of progress.